
Observations on MTA turnstile data (part 2)
In a previous post I showed where to find the MTA turnstile data and how to load the files into a Pandas data frame. Now I’ll take a closer look at the data, starting with the entry/exit timestamps.
The MTA provides cumulative entry/exit counts for each turnstile in 4-hour intervals. Each data point is timestamped, and one of the first things you’ll notice is that the timestamps vary between turnstiles.
Ideally turnstiles would be synchronized and use the same intervals for entry/exit counts. But, that’s not the case. Some turnstiles start counting from 0:00 (12AM) with the other data points at 4:00, 8:00, 12:00, 16:00, and 20:00. Other turnstiles start counting from 1AM with other data points at 5:00, 9:00, 13:00, 17:00 and 21:00. And yet others count from 3AM or 2AM.
The most common start times are 12AM and 3AM, but the other times represent a significant portion of the data set. This chart illustrates the distribution of intervals in the 2016 files.
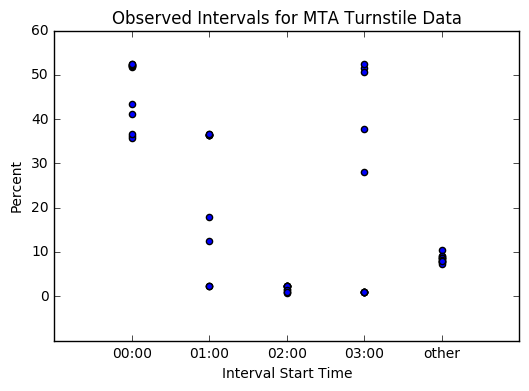
For each 4-week period, starting January 1st, February 1st, and so on, through December 1st, I calculated what percentage of the data fell into the four most common intervals. Note, no interval ever accounts for more that than 53% of the data points.
If you use the MTA data to determine what times riders enter/exit stations, don’t pick one interval and ignore the rest. Depending on the sample, you could be throwing away half your data!
In the preceding chart other is a catch-all for timestamps outside
the four most common intervals. These samples have odd times like
07:54:12, 14:49:05 and 08:50:06. They are present in every four-week
period and consistently account for about 9% of the data.
Fortunately, if you use the MTA data to count riders entering/existing
stations per day, none of the above discussion matters. The cumulative
entry/exit counts appear to be equally accurate for all intervals,
even the odd other ones.
However, there are other issues that will affect the daily ridership counts, and I’ll describe those in my next post.